Focus on buying breakouts on a bull market
Research · Market regime · Backtest
Open any momentum book and you'll find the same advice: only trade breakouts when the market is healthy.
O'Neil built it into CANSLIM. The M stands for Market. He said 3 out of 4 stocks follow the index, so don't fight it. Stan Weinstein wouldn't go long unless the index was in Stage 2. Mark Minervini won't push size unless the market is in a confirmed uptrend. Qullamaggie said it in many streams: when the market is bad, he sits in cash or trades small.
Nobody serious argues with this. Of course you trade more in a bull market. Everyone knows that.
But how much does it actually help and how to define bull market? Let's test it.
The setup
Same momentum breakout strategy I've been refining: tight bases, top-ranked names, normal entries and exits.
One change. SPY has to close above its 140-day EMA for the strategy to take a new trade. Below that line, no new entries. Open positions keep running their normal exit logic.
The experiment
We ran the same breakout strategy two ways. One without the filter and one with it.
Same universe, entries, exits and sizing. The only difference is whether the strategy can open new trades when SPY is below trend.
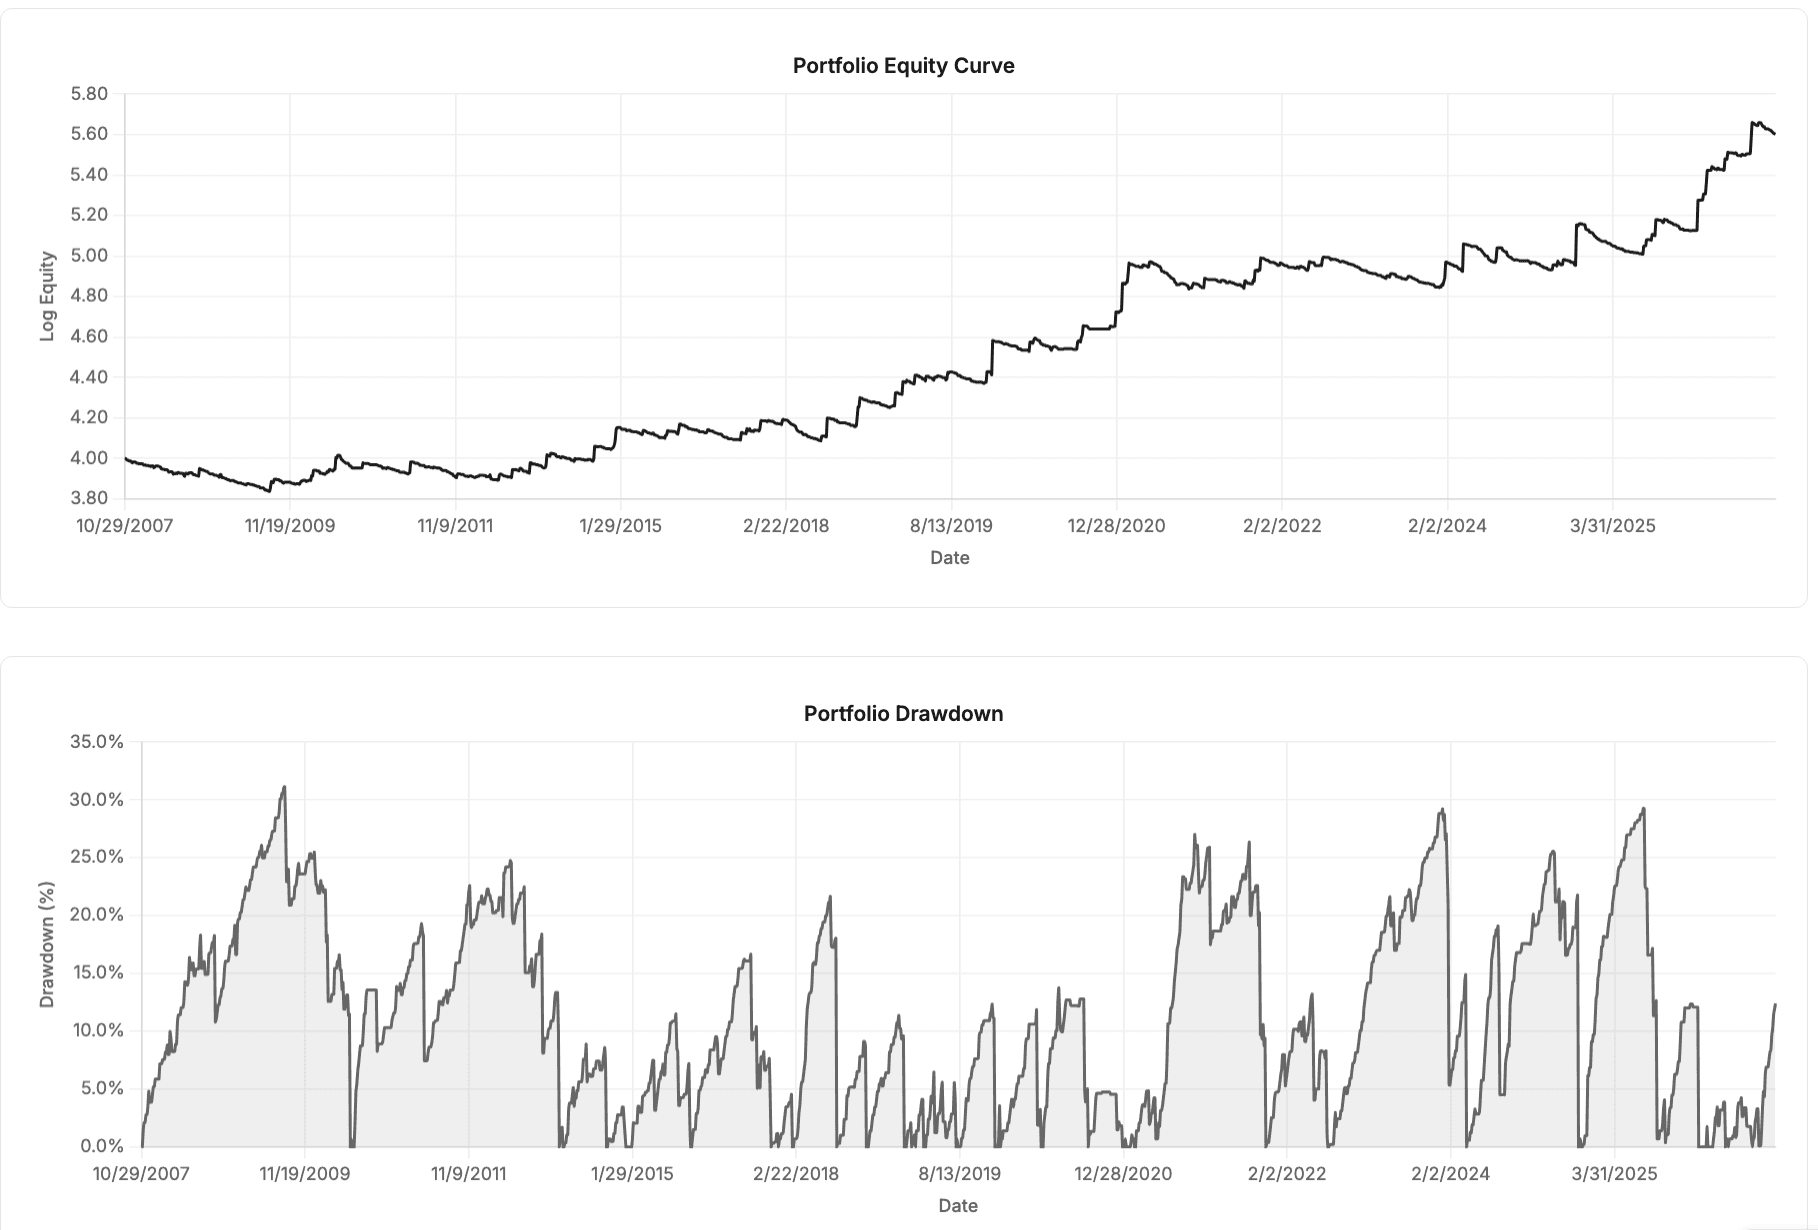
No regime filter
Every qualifying breakout gets taken, every year, no matter what SPY is doing.
Equity curve:
Stats:
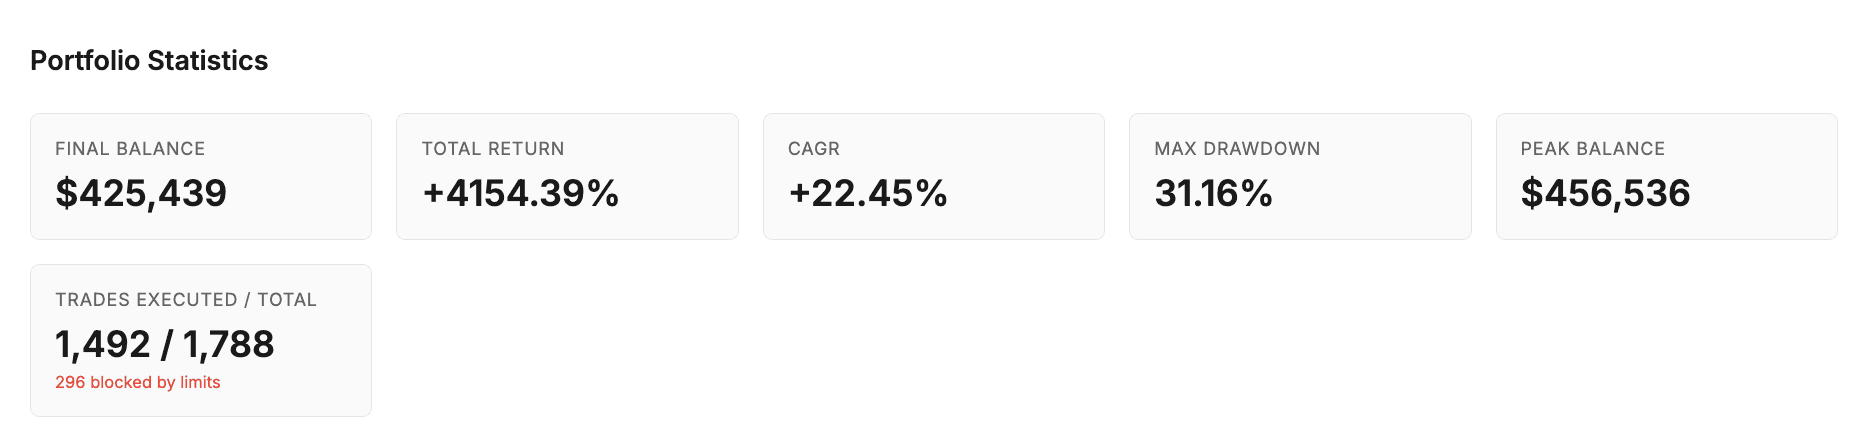
22.45% CAGR. 31.16% max drawdown. Total return 4154%. The strategy works, but a lot of the drawdown comes from breakouts in tapes that were never going to follow through.
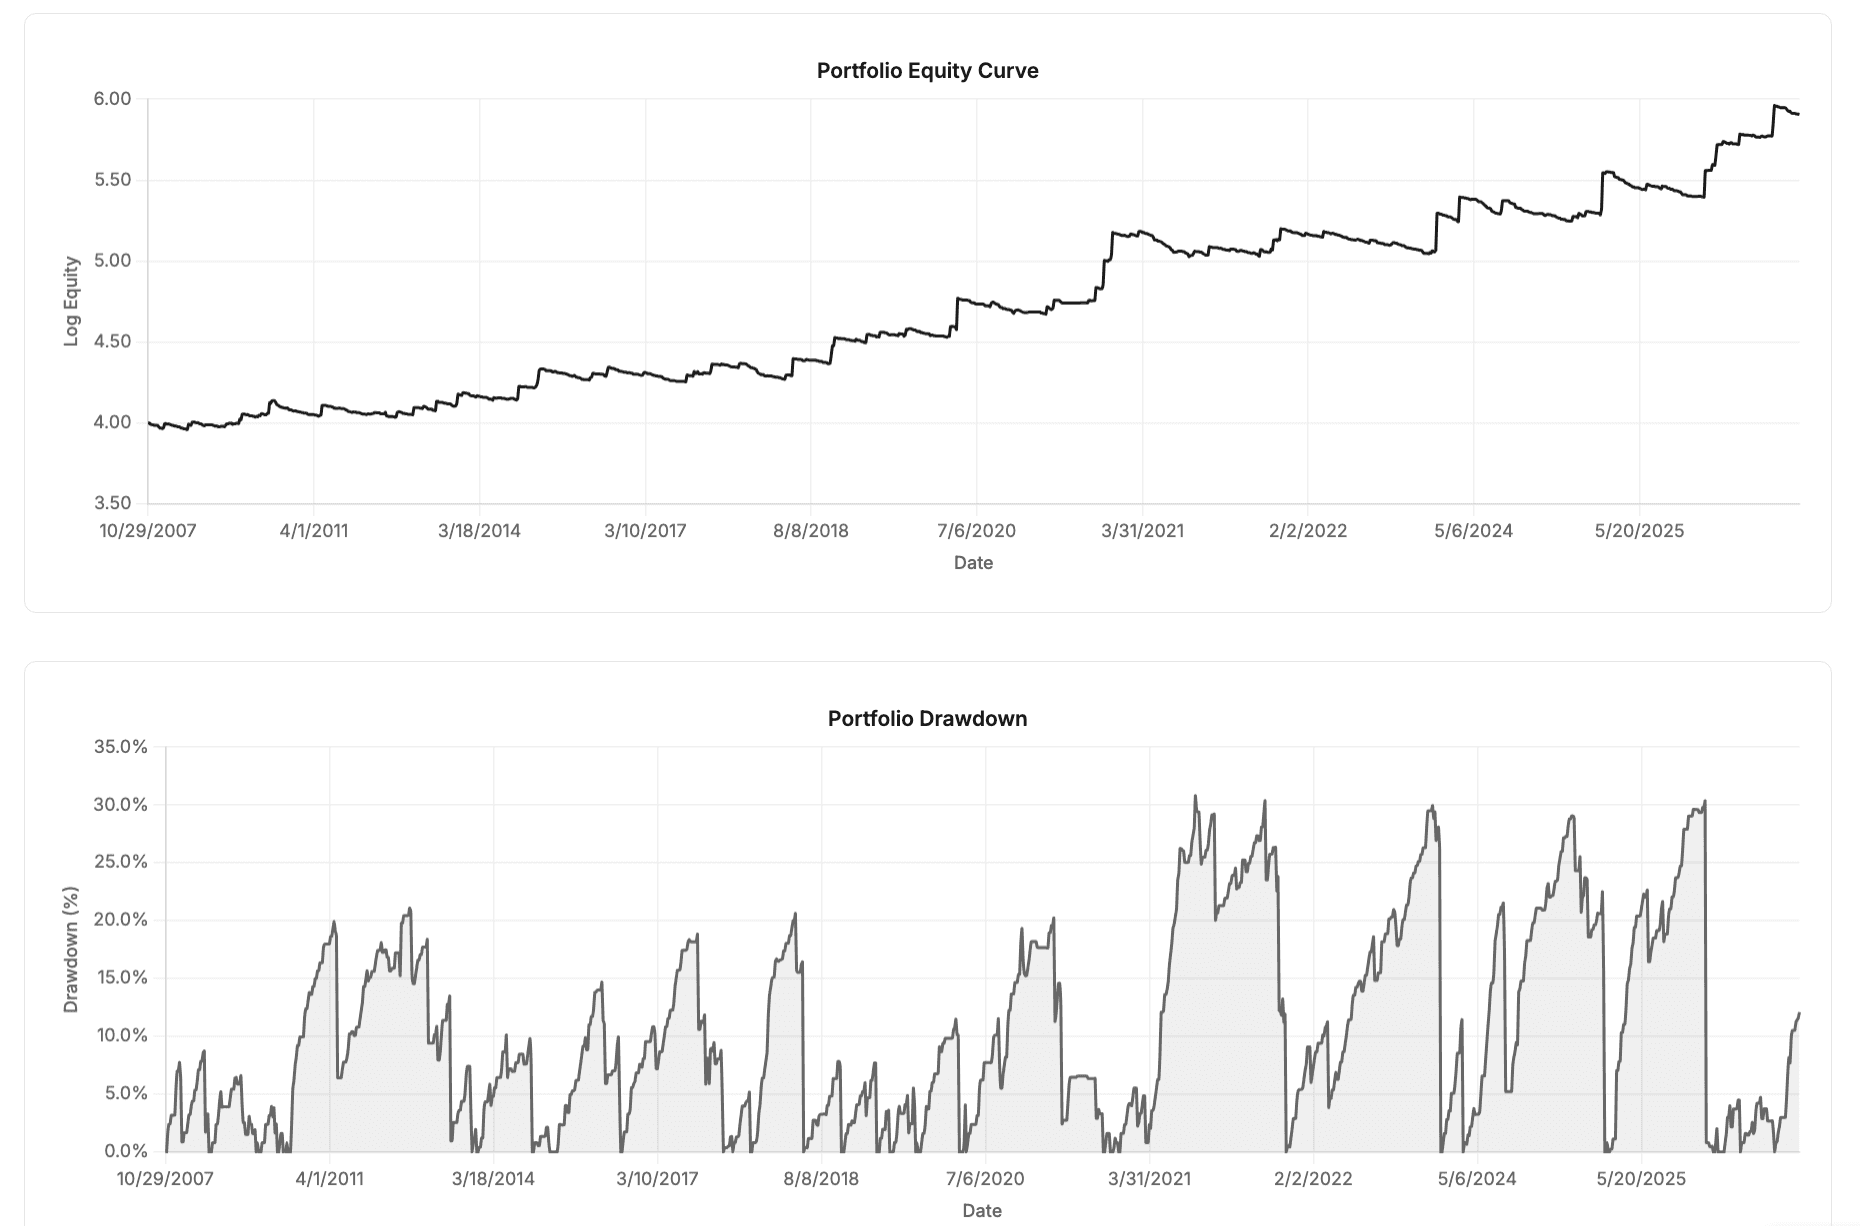
SPY above the 140 EMA
Same strategy. No new entries when SPY is below its 140 EMA. Existing positions exit on their normal stops and targets.
Equity curve:
Stats:
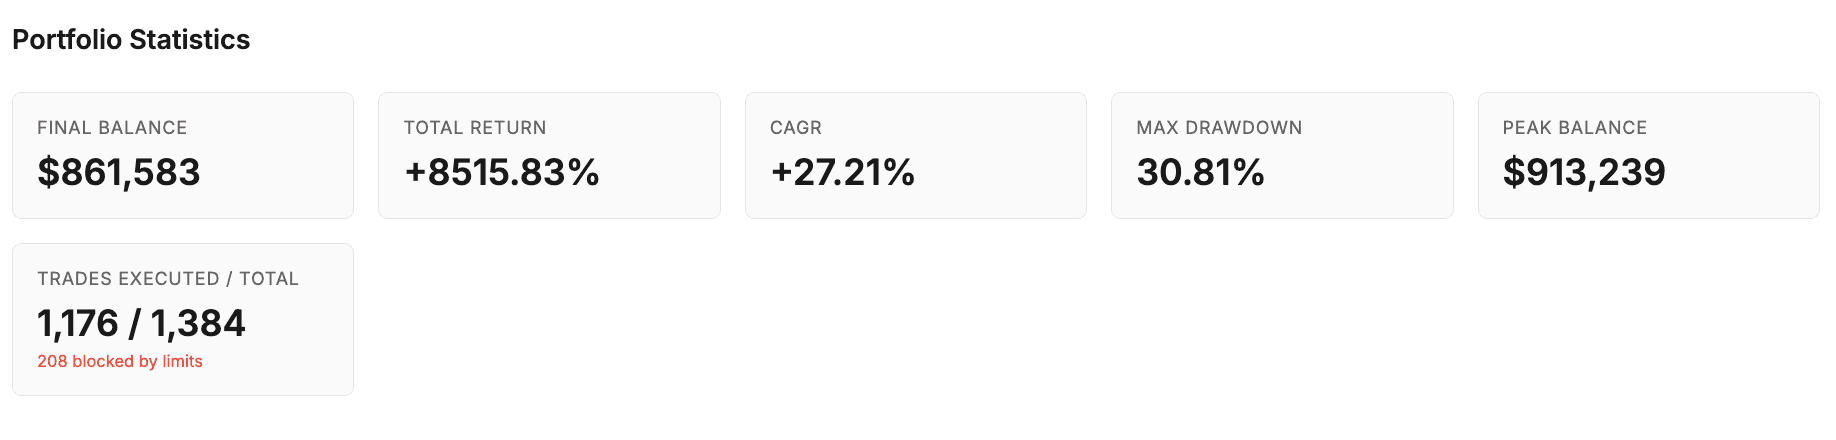
27.21% CAGR. 30.81% max drawdown. Total return 8515%. Almost five extra points of CAGR. Slightly less drawdown. And less time in the market.
What this means
Breakouts in a weak tape look the same on the chart. Tight base, clean trigger, volume. The follow-through just isn't there. Nobody is rotating into new leaders when the index is bleeding. The breakout pops, fades, stops you out a few days later. Do that enough times and it eats into real CAGR.
In a bull market the same setup gets bought. Every other momentum trader is also hunting for leadership. That's where the strategy compounds.
The 140 EMA is a blunt tool. It'll keep you out at the start of some recoveries and keep you in too long near tops. But the result isn't overfit to that exact length. A 150 SMA works. A 200 SMA works. The specific number matters a lot less than just having a regime filter at all.
But the direction lines up with what every serious momentum trader has said for decades. Nice to have a number on it instead of taking it on faith.
If you're running a momentum strategy without a market regime filter, you're paying for it in CAGR for the same max DD.