Focus on favourable NAAIM regime
Research · NAAIM exposure · Backtest
Momentum traders talk about market regime constantly. Index trend, breadth, risk-on versus risk-off. One number that shows up in almost every weekly conversation is the NAAIM Exposure Index — how aggressively active managers are actually positioned in U.S. equities.
It sounds like it should matter for breakouts. When pros are leaning in, new highs get bought. When they are de-risking, the same chart pattern fails more often. Everyone cites it. Few people backtest it on a specific strategy.
We did. Here is what showed up in the data.
What NAAIM measures
Each week, members of the National Association of Active Investment Managers report their net exposure to U.S. stocks. The published index is an average on a scale from about -200 to +200.
Zero means flat or fully hedged. 100 means fully invested. Above 100 means leveraged long. Negative means net short. The long-run median sits near 76. Extremes matter: the all-time high was above 120; the record low was barely negative during the 2011 European debt scare.
This is not a poll of how people feel. It is a poll of how they are positioned. That is why it is worth testing separately from retail sentiment surveys, which in our work added nothing to breakout PnL.
The setup
Same momentum breakout rules as our other backtests: liquid, volatile names; tight bases before the trigger; top relative-strength ranks; no new entries when the broad market is below trend.
For this test we did not turn trades on or off by NAAIM. We kept every qualifying breakout and tagged each trade with the exposure reading that was knowable at entry.
The experiment
We pulled historical NAAIM readings and matched them to every breakout in the database from 2007 through 2026.
Lookahead bias is easy to introduce here. The survey closes mid-week; the number is not available until Thursday morning. Because entries are at the open, we only allowed NAAIM data from the following session onward — effectively Friday — so each trade lines up with information a real trader could have used.
Trades were bucketed by the index level at entry. The band that stood out in the aggregate was 70–90: managers engaged, but not yet maxed out.
PnL by NAAIM bucket
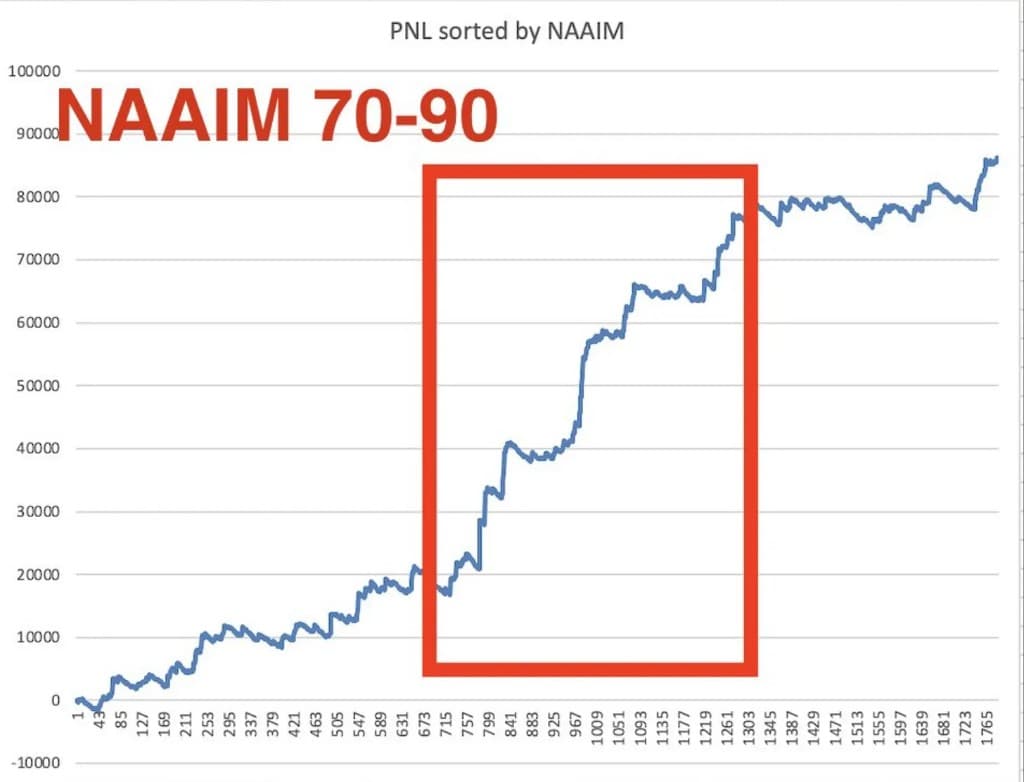
Sort trades by NAAIM at entry and stack cumulative PnL. Most of the lift clusters in the 70–90 band — the steep section in the chart below.
Stats by bucket:
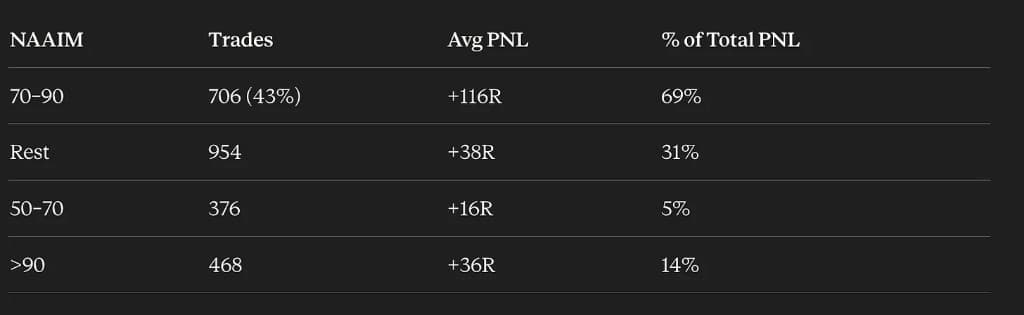
In the 70–90 bucket: 706 trades (43% of the sample), +116R average PnL per trade, 69% of total PnL. The rest of the book — 954 trades — averaged +38R and contributed 31%. Win rate barely moves across buckets; the edge is not more winners. It is bigger winners when NAAIM sits in that window.
Below 70, managers are still cautious — breakouts can work, but follow-through is thinner on average. Above 90, everyone is already in. Fresh buying that fuels a momentum leg has less room to run, and failures feel more common. Seventy to ninety is the band where positioning and breakout magnitude line up best in this sample.
Robustness
Leave-one-year-out: drop any single calendar year and the 70–90 bucket still shows a positive edge versus the rest, roughly +45R to +89R depending on which year is removed. Removing 2024 hurts the most; the edge falls to about +45.5R and remains positive.
Split at end of 2023: the pre-2025 subsample shows about +73.5R of edge; 2025 onward about +94.7R. Both sides positive.
Year-by-year is messier. The favourable bucket only beats the rest in nine of twenty years. Several stretches — 2011–12, 2015, 2017, 2019, 2021–22 — favour the other buckets. Much of the cumulative separation in the full sample comes from 2024–2025. Through 2023, favourable versus rest was nearly a coin flip on total PnL, about 48% versus 52%.
There is a plausible mechanism and enough mass in the backtest to use it, but it is not as clean as a single equity curve implies.
How we use it
NAAIM does not replace setup quality or market trend filters. It adjusts risk. Inside 70–90 we run roughly double normal size on new breakout risk. Outside that band we still take trades that qualify; we just do not press.
What this means
Regime tools are not interchangeable. Opinion surveys did not move our breakout results. Manager exposure did, specifically through the size of winning trades rather than how often trades won.
That fits how momentum actually pays: a minority of trades do most of the work. When institutions are positioned in the sweet spot, those winners have more room. When they are not, the same entry rules still fire, but the distribution of outcomes shifts.
Treat NAAIM as a sizing dial, not a binary on/off switch. The backtest supports leaning in between 70 and 90. It also argues for staying humble — the year-by-year record is uneven, and recent years carry a large share of the benefit. We will keep reporting the number and keep measuring whether the edge holds live.